Introduction
A research published by Stanford University in 2025 highlights how Trump’s claims on social media polarize public opinion. Trump’s disputed tags on his posts increased the perceived “truthfulness” of misinformation among his supporters. [1]
This data report delves into the reviews from the specific group, fact-checkers, who are recognized to be impartial and fair by the IFCN. It explores whether the polarization of views happened in the field of fact checking.
The report collects data with the API from Google FactChecker. The search contains the reviews of claims concerning the search term “Donald Trump” over the past ten years. Note that the collected data is not inclusive and subject to the limitation of the search term and excludes non-English claims.
Data analysis
Generally, fact-checkers comment mainly on source credibility and the reporting accuracy. The most common words in the reviews are “correct attribution”, “labeled satire” and “fake post”, which are relevant to fact-checkers’ task to debunk incorrect information. Other than contextual phrases like “executive order” policy, there is a range of descriptions which comment on problematic claims made by Donald Trump, such as “distort facts”, “incorrect attribution” and “false claims”. And the scale of falsehoods ranges from “mostly true” to “mostly false”. Yet, reviewing the claims as “true” is rarely seen.

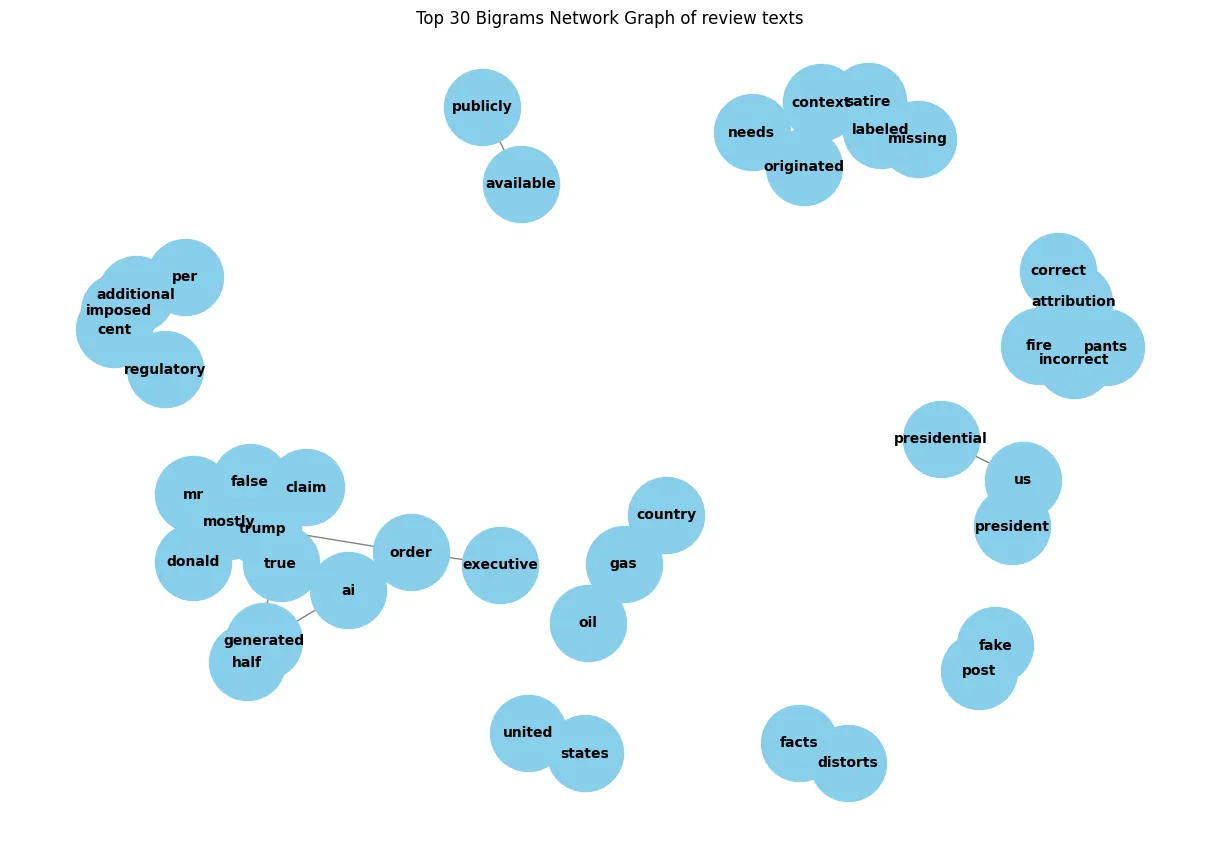
The Network graph below provides us a clearer picture of how some words often appear together in the reviews. For instance, the credibility of sources are related to words like “fire pants” (idioms of “liars”) and “attribution”; “false” with “claim”; “needs” with “contexts”. These pairs form the critique on the claims.
Claims about certain policy topics are frequently being fact-checked: phrases “additional imposed,” “cent,” “per,” and “regulatory” often appear together in contexts related to tariffs, taxes, and regulatory duties, such as the recent announcement of additional tariff. [2]

Applying the ML-based model sentiment analysis, the report then moves to the positive and negative reviews of claims. The report seeks assistance from the ML-model to classify all reviews into neutral, positive and negative in order to gain an overview of the fact-checker’s attitude. Note that the ML-model provides little justification for the scoring and classification, thus the classification is not absolute.
The negative reviews focus on the credibility of sources and accuracy of reporting as mentioned above without surprise. The comments are critical and determined, including strong words like “fake post”, “false claims”, “fire pants”, “needs context”. The words “correct attribution” appear because fact-checkers may make request for a correct attribution of source in the Factchecking platform.
As for the positive side, only the words “clips real” directly endorse Trump’s claims. Affirmative views toward the claims are hardly found in the research. Words in the positive side mostly express concerns on the credibility of the claims, but in a mild tone. For example, the “edited photo”, “cherry picking”, “four pinocchios” are all relevant to the concern of fake news.
It seems that the positive and negative review shares the same view that Donald Trump’s claims lack reliable evidence and demonstrates falsehood. Both sides frequently leave “labeled satire” or “satire label” in their reviews, which is a neutral gesture to distinguish the nature of claims.

It is noticeable that the negative reviews dominate the field. The top 10 publishers have made no positive reviews, according to the sentiment analysis, which aligns with the duty of fact-checkers as to debunk misinformation. Comparing among all publishers, “Lead Stories” stands out as the most published and the most negative in the sentiment score among all other fact-check agencies.
Enlarging the dataset to cover all publishers, it is observed that the average sentiment score centralizes between 0.5 to 0.75, which may indicate that most of the fact-checkers’ views fall between neutral to critical toward the claims. The variation depends on the tones and language. Even when debunking false claims, there is a huge difference on sentiment score between a balanced and neutral tone and the critical one.
Meanwhile, the two outliers, “Ghana fact” and “WLTX” show the most negative and positive views respectively, which can be explained by the background and editorial style of the agency. They are far from the main trend. It is important to note that sentiment analysis models can sometimes misinterpret the sentiment of complex or nuanced text. The model might pick up positive words or phrases within a generally negative review, leading to a higher sentiment score.


Conclusion
This dataset shows that fact-checkers are not likely to be influenced by the polarized public opinions on Donald Trump. The analysis suggests that they focus on source credibility and the reporting accuracy in both positive and negative reviews. The variation of attitude is mostly in the tone and language. The comments on false news can vary from a mild one like “edited photo” and neutral “satire label” to critical tone like “false claim”.
[1]: https://humsci.stanford.edu/feature/new-study-shows-partisanship-trumps-truth
[2]: https://www.cbp.gov/newsroom/announcements/official-cbp-statement-tariffs
https://colab.research.google.com/drive/1PMmTjRXuZYI591bzjQORKvuWsYtd0P6n?usp=sharing

Leave a Reply